XRP bounces from mid-range support, but advantage remains with bears
Disclaimer: The information presented does not constitute financial, investment, trading, or other types of advice and is solely the writer’s opinion.
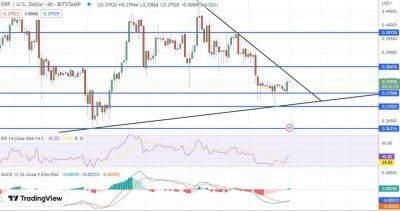
Ripple [XRP] traded within a range and the bulls forced a bounce from the mid-range mark at $0.37. While this bounce inspired lower timeframe bullish momentum, the evidence at hand showed that $0.395 could pose stiff resistance to the price.
How much are 1,10,100 XRPs worth today?
Hence, XRP buyers from the $0.37 area can use a test of the $0.38-$0.39 area to take profits. Thereafter, a breakout upward or a rejection will reveal the direction of the next move.
Source: XRP/USDT on TradingView
The VPVR tool showed the Point of Control (red) to lie at $0.387. Above this level lay a horizontal long-term significance level at $0.395. Hence, it was likely that the bounce from $0.37 would meet stern resistance in this zone. Yet, the defense of $0.37 is significant as well.
Since November, XRP has traded within a range (yellow) between $0.33 and $0.41. The mid-point of this range was $0.37. The selling pressure in February saw XRP unable to break out past the range highs and was forced to drop to the mid-range mark.
Although the Awesome Oscillator was beneath the zero line to denote bearish momentum held sway, buyers can be on the lookout. Lower timeframes such as the one-hour show the market structure was flipped to bullish, and the $0.372-$0.376 region will be defended by buyers.
However, the structure and momentum on the daily timeframe were bearish, so any buys from $0.37 could be sold around the $0.39 area. The CMF was in neutral territory and did not show strong capital inflow yet.
Is your portfolio green? Check the XRP Profit Calculator
Source: Coinalyze
The four-hour chart showed
Read more on ambcrypto.com


![Bitcoin [BTC] bears show signs of weakness as this metric slows down - ambcrypto.com](https://finance-news.co/storage/thumbs_400/img/2023/2/25/57279_vhl.jpg)


