Litecoin Price Prediction as $1 Billion Trading Volume Makes LTC Top 10 Most Traded Crypto in the World – What's Going On?
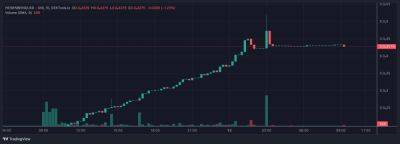
Litecoin, one of the prominent cryptocurrencies, has garnered significant attention in the market, with a trading volume surpassing $1 billion. As a result, Litecoin has secured its position among the top 10 most traded cryptocurrencies globally.
This development has sparked curiosity among investors and observers, leading to the question. Let's explore the technical indicators and patterns in this Litecoin price prediction.
The price of Litecoin today stands at $94.05, accompanied by a 24-hour trading volume of $5.4 million. Over the past 24 hours, Litecoin has experienced a decrease of nearly 3%.
Currently ranked at #11 on CoinMarketCap, Litecoin holds a live market cap of $6.8 billion.
With a circulating supply of 73,326,202 LTC coins and a maximum supply of 84,000,000 LTC coins.
Upon analyzing the technical aspects of Litecoin, we observe that it has a 61.8% Fibonacci retracement at the $93.35 level, identified as a significant support.
Conversely, it faces strong resistance near the $98.45 level, reinforced by the 50% Replacement level.
In terms of indicators, the 50-day exponential moving average acts as a resistance around the $99 level, while the relative strength index (RSI) and moving average convergence divergence (MACD) indicators are currently in the sell zone, with RSI at 31 and MACD at -0.11.
If the support level at $93 is breached, we may witness a downward movement toward the next key support level at $88.9, marked by the 78.6% Replacement level.
Further downward pressure could push LTC toward $83.86 or even $82.
On the other hand, in the event of a bullish breakout above the $98.45 level, the next resistance levels to watch are $102 and $107.
Wall Street Memes, a popular online community for retail
Read more on cryptonews.com


