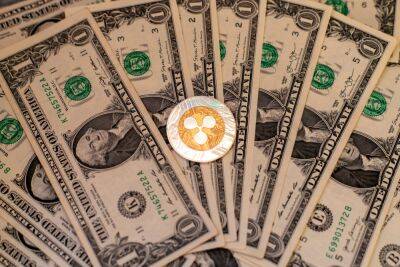
XRP buyers drove the alt to $0.34, but sellers could still have an upper hand
Disclaimer: The findings of the following analysis are the sole opinions of the writer and should not be considered investment advice.
The short-term trend was bullish for XRP. Yet, data from Coinglass showed that the futures market was almost exactly evenly balanced. In fact, a slight edge went to the short positions in terms of volume.
On the higher timeframe charts, a three-month range was spotted. The highs of this range would offer a decent selling opportunity. Patience would be required before XRP bulls can effect a breakout.
Source: XRP/USDT on TradingView
In early June, XRP broke beneath the $0.38 support level. Since then, the same zone has acted as a stiff resistance. In the intervening months, the price has formed a range (yellow) from $0.3 to $0.38. The mid-point of this range at $0.34 has also acted as support and resistance.
In August, XRP tried for nearly two weeks to break above the $0.38 mark. Halfway through the month, the bulls were exhausted and the price crashed straight beneath the mid-point of the range. It dropped once again a few days later to the $0.32 level.
At the time of writing, the bulls have flipped the script and pushed prices past the $0.34 mark.
Source: XRP/USDT on TradingView
The indicators noted a flip in the bearish momentum. The Relative Strength Index (RSI) was able to climb past neutral 50 and flip it to support. It stood at 61 at the time of writing. This showed upward momentum was strong and could continue. The Accumulation/Distribution (A/D) line also broke above a resistance level from May.
This development was far more significant. However, it does not necessarily mean a move above $0.38 is around the corner. Rather, it indicates that such a breakout has begun to brew, and could occur
Read more on ambcrypto.com


