Dogecoin [DOGE] sinks to support zone as momentum turns bearish
Disclaimer: The information presented does not constitute financial, investment, trading, or other types of advice and is solely the writer’s opinion.
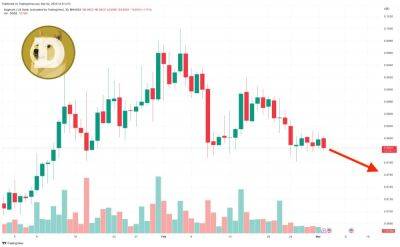
Dogecoin [DOGE] rallied from the $0.079 level on 10 February to reach $0.092 on 16 February. While this rally amounted to 16% from the swing low to the swing high, it met stiff resistance at $0.089. In the past few days, these gains were almost fully retraced.
Read Dogecoin’s [DOGE] Price Prediction 2023-24
Bitcoin [BTC] ran into some resistance just beneath the $24k mark on Monday. Its lower timeframe structure was bearish, and another 5% drop was a possibility. What could such a dump mean for DOGE traders?
Source: DOGE/USDT on TradingView
Dogecoin has traded within a range between $0.08 and $0.099 for six weeks, since mid-January. At the time of writing, the price was close to the lows of the range. The RSI on the daily chart was also bearish. Its attempt to climb back above neutral 50 during the rally to the mid-range mark was thwarted after the price faced rejection. The bias would flip bearish if the daily session closed beneath the range lows.
The OBV has been in decline throughout February. This suggested that selling pressure was strong, and the dominance of the sellers could drive prices further lower. However, trading volume has also fallen alongside the prices. This highlighted the lack of a strong long-term downtrend. Therefore, it was possible that DOGE could witness a bounce.
Whether there is a surge in prices or a sharp decline, two things were true. The $0.078-$0.08 zone has offered steady support over the past month. It offered a good risk-to-reward buying opportunity, with a clear invalidation on a daily close below $0.078. Hence, aggressive traders can
Read more on ambcrypto.com


![Why Dogecoin holders may care less about the Shiba Inu [SHIB] expansion - ambcrypto.com - city Santiment](https://finance-news.co/storage/thumbs_400/img/2023/3/3/58255_vkg.jpg)


![Decoding the reasons behind Maker’s [MKR] upward momentum - ambcrypto.com - city Santiment](https://finance-news.co/storage/thumbs_400/img/2023/3/3/58152_0cpia.jpg)


![Apecoin [APE] retests $4.9 support as bulls wait for recovery - ambcrypto.com - city Santiment](https://finance-news.co/storage/thumbs_400/img/2023/3/3/58125_pur.jpg)
![Filecoin’s [FIL] recovery slowed – Can bulls sustain the momentum? - ambcrypto.com - city Santiment](https://finance-news.co/storage/thumbs_400/img/2023/3/2/58084_tbn.jpg)
![Ethereum [ETH] bounces from $1600 but bearish bias remains: Here’s why - ambcrypto.com](https://finance-news.co/storage/thumbs_400/img/2023/3/2/58064_7erbp.jpg)


