Dogecoin [DOGE]: Short-term investors could gain, but only if…
Disclaimer: The information presented does not constitute financial, investment, trading, or other types of advice and is solely the writer’s opinion.
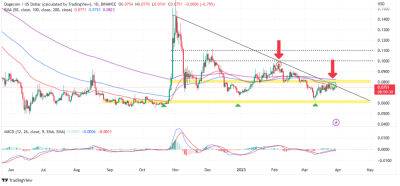
The higher timeframe price charts of Dogecoin [DOGE] showed strong bearish pressure on one of the most popular meme coins. The $0.08 region has posed stern resistance since early March, and this does not look likely to change soon.
Read Dogecoin’s [DOGE] Price Prediction 2023-24
Bitcoin [BTC] could see some volatility after dropping to $26.5k on 27 March. In this scenario, a bounce for DOGE would offer short sellers a better risk-to-reward region to sell Dogecoin.
Source: DOGE/USDT on TradingView
There were two scenarios that short-term bears can watch out for. One is a drop beneath the $0.071 region, highlighted in cyan. This would be a strongly bearish scenario, and bears can look to short the retest of this region as resistance. They can target the zones of support at $0.068 and $0.065 to take profits. An extremely wide stop-loss can be used above the recent Monday’s swing high.
The blue line at $0.0713 marked a strong lower timeframe zone of support for DOGE. The second scenario that could unfold was a bounce from this region that reached the $0.075-$0.078 area.
A move into this zone can also be shorted, with a stop-loss above the $0.0805 mark. This could offer a better R: R trade and sellers can take partial profits at the support zones if they choose to.
The RSI on the two-hour chart has not surfaced above neutral 50 since 24 March, which highlighted a near-term downtrend. The CMF was also at -0.10 to indicate significant capital flow out of the Dogecoin market.
Realistic or not, here’s DOGE’s market cap in BTC’s terms
Source: Coinalyze
Dogecoin reached a swing high of $0.0764
Read more on ambcrypto.com


![Dogecoin [DOGE]: Elon Musk cites this reason to dismiss $258 billion lawsuit - ambcrypto.com - Usa - city Manhattan](https://finance-news.co/storage/thumbs_400/img/2023/4/1/62513_wtn.jpg)

![Justin Sun - Tron [TRX]: Will new upgrade foster stagnant staking activity? Gauging… - ambcrypto.com - Usa](https://finance-news.co/storage/thumbs_400/img/2023/4/1/62473_ppg.jpg)


