Bitcoin Price Prediction as BTC Approaches $27,000 Resistance Level – What is the Next BTC Target?
Bitcoin's ascent towards the critical resistance level of $27,000 has hit a roadblock, as the cryptocurrency struggles to break above this key level.
The recent price action has resulted in the formation of an inverted hammer candlestick pattern, signaling potential selling pressure.
If Bitcoin fails to cross above the $27,000 mark, it could present a profitable sell trade opportunity.
In this Bitcoin price prediction, we will dive deeper into the technical outlook of BTC to assess the probability of a sell trade.
The current price of Bitcoin stands at $26,813, having a trading volume of $15.5 billion over the past 24 hours.
In this time frame, Bitcoin has witnessed a positive growth of nearly 1.50%. With a live market cap of $520 billion, Bitcoin holds the top position on CoinMarketCap's ranking.
It has a circulating supply of 19,407,475 BTC coins, out of a maximum supply of 21,000,000 BTC coins.
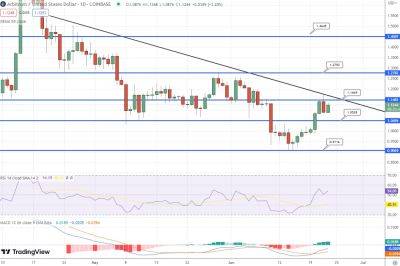
Taking a closer look at the technical analysis of Bitcoin, it has encountered significant resistance at the $27,000 level.
On the four-hour chart, there is a downward trend line that originated from the recent peak on May 29 and reconnected with the price action on June 20.
Bitcoin failed to break above this trend line and formed an inverted hammer candlestick, suggesting weakening bullish momentum.
The presence of consecutive indecisive candles indicates a shift in control from buyers to sellers.
The key support level for Bitcoin is around $26,275, and a breakdown below this level could expose it to the next support at $25,590.
Further downside movement may lead to the next support level at $24,860.
Despite these bearish signals, the relative strength index (RSI) and moving average convergence divergence (MACD) indicators still
Read more on cryptonews.com


