Bitcoin [BTC] breaks past $24k after CPI report: A rally in the making?
The initial reactions to 13 February’s release of the Consumer Price Index data on Bitcoin [BTC] were divided. Recent pricing activity, however, suggested it had weathered the storm reasonably with a return to a range seen months ago. So, is this a temporary upswing or the beginning of a new trend?
Read Bitcoin’s [BTC] Price Prediction 2023-24
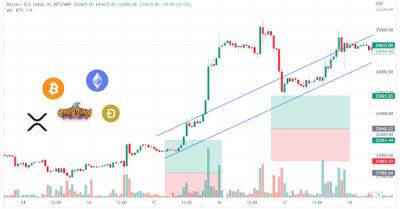
Bitcoin entered the $24,000 price level for the first time since August at the close of trading on 15 February. A daily timeframe analysis of the price movement revealed that it had increased in value by the end of trading by 9.47%. It was trading at about $24,500 as of this writing and had reached $24,800 in the same time, with over a 1% gain already registered.
Source: Trading View
There was a correlation between the price movement and the volume, as seen by a check at the On Balance Volume (OBV). This points to a positive price movement for BTC. A good price move was also indicated by a movement above the long and short Moving Averages (blue and yellow lines).
According to the Relative Strength Index (RSI), the asset was in a strong bull trend. The RSI line was above the neutral region and appeared to be moving toward the overbought territory.
Despite this surge, most traders continued to take short positions against Bitcoin. Most exchanges were dominated by short holdings, as indicated by the Net Position shift seen on Glassnode. This was a sign that the asset’s price might decline.
Source: Glassnode
Additionally, a glance at Coinglass’s BTC Long/Short Ratio revealed a constant battle between long and short takers across exchanges. But as of this writing, the longs were edging, standing at around 59%, while the shorts were at about 40%.
Source: Coinglass
On the other hand,
Read more on ambcrypto.com

![Maker’s [MKR] consolidation phase underway – is a 10% hike likely? - ambcrypto.com - city Santiment](https://finance-news.co/storage/thumbs_400/img/2023/2/23/56986_pyyws.jpg)


![Will Clemente - Bitcoin [BTC] and S&P 500 part ways, where now for the king coin? - ambcrypto.com - city Santiment - city Santimentit](https://finance-news.co/storage/thumbs_400/img/2023/2/23/56975_hnlau.jpg)


![Solana [SOL] cuts into last week’s gains, retests 50% Fib level - ambcrypto.com](https://finance-news.co/storage/thumbs_400/img/2023/2/23/56950_ytmnd.jpg)


![Dogecoin [DOGE] sinks below $0.085, here’s where buyers can set their bids - ambcrypto.com](https://finance-news.co/storage/thumbs_400/img/2023/2/23/56932_ipokl.jpg)
![How has The Sandbox [SAND] fared a week after unlock? Unravelling… - ambcrypto.com - city Santiment - city Sandbox](https://finance-news.co/storage/thumbs_400/img/2023/2/22/56920_ezpmv.jpg)


